![]() Inspired by the blog post at nanard.org, I’ve spent a few days hacking on promise_summary.log and rrdtool, and I have finally something to show.
Inspired by the blog post at nanard.org, I’ve spent a few days hacking on promise_summary.log and rrdtool, and I have finally something to show.
Let’s recap quickly: a file promise_summary.log in cfengine’s workdir (usually /var/cfengine) contains a summary of every agent run: when the run started and finished, which version of the policy has run, and how many promises (in percentage) were kept, repaired, and not repaired. The first thing I wanted were graphs for these metrics; a medium-term goal is to bring these metrics into some well known tool like Munin or Cacti — that will come later.
I chose to use RRDtool for many reasons; among all:
- it takes care for both saving the data and making the graphs;
- it saves the data at different resolutions, automatically;
- all aspects of a graph are customizable, and different type of graphs can be embedded in the same picture
I had previous experience with RRDtool, and I knew the downsides of course, mainly: the odd, cryptic syntax. What I had forgotten since such a long time was that it’s actually easier than it looks 🙂 …
Create the round-robin database
Since we are going to use RRDtool, the first step is to create a round-robin database (an RRD file). When one runs the following shell script, create_rrd.sh, providing the path for promise_summary.log as an argument, it will create the appropriate RRD file:
#!/bin/bash

START=$(head -n 1 $1 | awk -F, '{ print $1-10 }')

rrdtool create promise_summary.rrd
  --start $START --step 300
  DS:duration:GAUGE:600:0:U
  DS:kept:GAUGE:600:0:100
  DS:rep:GAUGE:600:0:100
  DS:notrep:GAUGE:600:0:100
  RRA:AVERAGE:0.5:1:2016
  RRA:MIN:0.5:1:2016
  RRA:MAX:0.5:1:2016
  RRA:AVERAGE:0.5:6:1920
  RRA:MIN:0.5:6:1920
  RRA:MAX:0.5:6:1920
  RRA:AVERAGE:0.5:60:2400
  RRA:MIN:0.5:60:2400
  RRA:MAX:0.5:60:2400
The first line reads the first timestamp in the first line of the log, subtracts 10 seconds from it, and assigns the result to the variable START. That value is then used as a starting timestamp for the RRD. The step in which we collect the samples is 300 seconds (the normal interval between two runs of an agent).
We create nine round-robin archives (RRA) in the RRD:
- the first three are created so that it can save 12 points per hour for 7 days, so: 12*24*7=2016 points;
- the second group will save 2 points per hour for 40 days, so: 2*24*40=1920 points;
- the third group will save 1 point every 4 hours for 400 days, so: 0.25*24*400=2400 points;
- we save the average, the minimum, and the maximum of the values collected in an interval
Load data into the RRD
The second step is to parse the log, and load the data into the RRD. This is Perl’s job, and that’s parse_summary.pl. This script takes the path for parse_summary.log as an argument, and prints the data in a format suitable to rrdtool update:
#!/usr/bin/perl

use strict ;
use warnings ;

my $last_start = 0 ;

while (my $line = <>) {
    next if $line =~ m{failsafe.cf}i ;

    my @field = split(/:s+/,$line) ;
    my ($start,$finish) = split(",",$field[0],2) ;

    # skip this sample if the clock went backwards
    next if $start < $last_start ;

    # this sample is valid ;
    my $duration  = $finish-$start ;

    # we don't feed RRD with version strings, so it's commented out
    # my ($version) = m{version (.+) (} ;

    my ($kept,$rep,$notrep) =
	( $line =~ m{Promises observed to be kept (d+)%, Promises repaired (d+)%, Promises not repaired (d+)%} ) ;

    print join(":",$start,$duration,$kept,$rep,$notrep),"n" ;

    $last_start = $start ;
}
It’s basically the same one-liner we’ve seen before, with two important differences:
- we skip entries with an earlier timestamp than the previous entries (rrdtool would refuse to update);
- we don’t print version information (rrdtool doesn’t know how to handle it).
Chaining parse_summary.pl with rrdtool update like so:
./parse_summary.pl /var/cfengine/parse_summary.log | xargs rrdtool update promise_summary.rrd
will load the data into the RRD.
Graphing the data
Now that the data is into the RRD, it’s time for graphs. Many geeks show a rather bad taste when choosing graph colors, and I’m no exception, so rather than trying to choose them myself, I referred to the wonderful Solarized work.
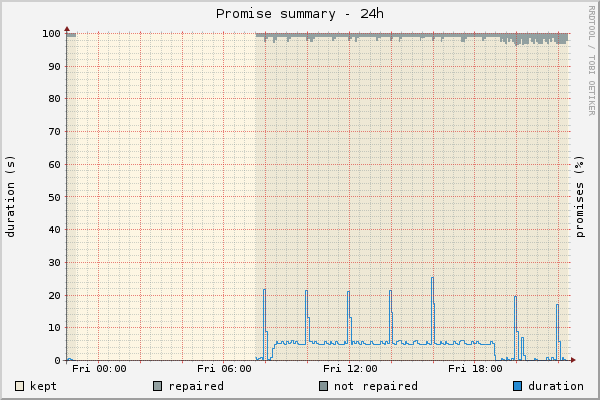
The percentage of kept, repaired, and not repaired promises should always sum up to 100 (except when rrdtool rounds off the numbers a bit perhaps), so they are good candidates for a stacked area graph. On top of them, I’ll put a line graph of the duration. For the canvas, I chose the base light colour (base3), and the promise percentage got the three darker base colours following base3 for themselves (base2, base1, and base0 for kept, repaired, and not repaired respectively). The major grid lines, usually red, got the red colour from the Solarized palette, and the minor grid lines got base00. Finally, the duration line gets the blue colour.
Before getting to the meat of the code, let’s see how it looks like:

(Update: don’t sweat trying to find not-kept areas in the graphs: there are none)
“De gustibus non est disputandum“, they say. I find it’s nice and beautiful. Let’s see how one can make such a graphs, and more.
The following script, create_promise_graph.sh, will create graphs for the last 6 hours, 24 hours, 7 days, 30 days, and one year.
#!/bin/bash

IMAGE_OPT="--width 600 --height 400 --full-size-mode --imgformat PNG "
COLOR_OPT="--color CANVAS#fdf6e3 --color MGRID#dc322f --color GRID#657b83"
OPTIONS="$IMAGE_OPT $COLOR_OPT"

for TIMERANGE in 6h 24h 7d 30d 1y
do
    rrdtool graph promises-$TIMERANGE.png
	--end now
	--start "end-$TIMERANGE"
	--title "Promise summary - $TIMERANGE"
	--vertical-label "duration (s)" --right-axis-label "promises (%)"
	$OPTIONS
	DEF:kept=promise_summary.rrd:kept:AVERAGE
	DEF:rep=promise_summary.rrd:rep:AVERAGE
	DEF:notrep=promise_summary.rrd:notrep:AVERAGE
	DEF:duration=promise_summary.rrd:duration:MAX
	AREA:kept#eee8d5:kept
	AREA:rep#93a1a1:repaired:STACK
	AREA:notrep#839496:not repaired:STACK
	LINE1:duration#268bd2:duration
done
Everything should be quite clear after the discussion above, so I’m not getting into the details here. If you’re interested in all of the graphs, you’ll find them at the end of this post.
Putting it all together
The smarter way to put this stuff all together and automate it smartly is, in my humble opinion, a makefile. Not only make will run all the actions in the right order: it will not run the whole bunch if it’s not necessary. Let’s see.
LOG=/var/cfengine/promise_summary.log
IMAGES=promises-1y.png  promises-24h.png  promises-30d.png  promises-6h.png  promises-7d.png
RRD=promise_summary.rrd

all: $(IMAGES)

$(IMAGES): create_promise_graph.sh promise_summary.rrd
	./create_promise_graph.sh

$(RRD): $(LOG) parse_summary.pl create_rrd.sh
	./create_rrd.sh $(LOG)
	./parse_summary.pl $(LOG) | xargs rrdtool update $@

clean:
	-rm $(IMAGES) $(RRD)
The first three lines are just variable assignments. The good thing about them is that you can override them on the command line. So if, for example, you want to test these script on a local copy of the log, you’d just use a command line like:
make LOG=/tmp/promise_summary.log
The target “all” is the first one, hence the one that will be executed if you run make alone. It will require all the images listed in the IMAGES variable to be up to date. In turn, and that’s the second target, the images will be considered up to date only when their prerequisites are up to date, including the RRD file. This brings us to the third target, the RRD file, that will be considered up to date only if the log file wasn’t updated earlier than the RRD file. If that is the case, make will run the commands to rebuild that target file; you know those command because we’ve talked about them above.
Rebuilding the RRD file starts a chain reaction, where now the RRD has been updated later than the images, so the images are rebuilt as well, and again: you know what the “create_promise_graph.sh” script does. And that would be… all.
When all of this happens, the output of make looks like this:
bronto@murray:~/Lab/promise-summary$ make
./create_rrd.sh /var/cfengine/promise_summary.log
./parse_summary.pl /var/cfengine/promise_summary.log | xargs rrdtool update promise_summary.rrd
./create_promise_graph.sh
600x400
600x400
600x400
600x400
600x400
Now, if you run again the make command again before the next agent run, the log file won’t have changed, so make won’t sweat on rebuilding your stuff:
bronto@murray:~/Lab/promise-summary$ make
make: Nothing to be done for `all'.
Smart, nice, and included in your operating system for free 😉 Have fun!
Bonus: all the graphs