After parsing promise_summary.log, it's time for graphs. I wanted to do something with RRDTool, but I am too tired now to make a clear reasoning. So I extracted a subset and used LibreOffice Calc to graph the duration of the agent runs, and the percentages of promises kept, repaired, and not repaired. … 
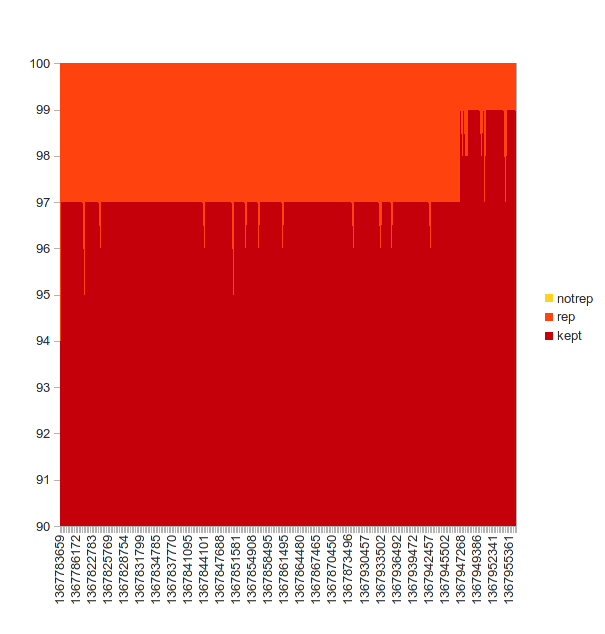
Nice to see that my debug/tuning work had so nice and positive effects 🙂
