This is a note-to-self style post 😉
Today I needed a simple graph to propose a re-engineering of a Terraform module of ours. I could of course use a tool like LibreOffice Draw, or maybe ask AI to give it a shot; but being the graph so simple, I thought I would just resume the little knowledge of GraphViz I had from before to solve this even quicker. I fired a couple of quick questions to ChatGPT to refresh the basics, and woop! In 5 minutes I had my graph:
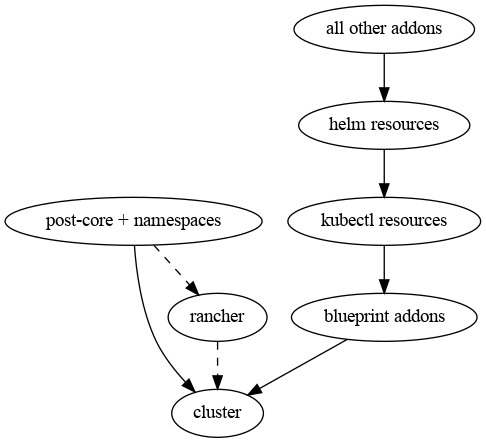
digraph ModEks {
  cluster;
  postcore [label="post-core + namespaces"];
  rancher;
  blueprint [label="blueprint addons"];
  kubectl [label="kubectl resources"];
  helm [label="helm resources"];
  addons [label="all other addons"];

  rancher -> cluster [style=dashed];
  postcore -> rancher [style=dashed];
  postcore -> cluster;
  blueprint -> cluster;
  kubectl -> blueprint;
  helm -> kubectl;
  addons -> helm;
}
I think it’s easy to understand what this code does (and if not, it will be once you glance at the diagram), so I’ll skip the explanation.
I saved this code into a file called ModEks.dot and then ran this command in a terminal:
dot -T png ModEks.dot -o ModEks.png…and there was my graph: