 I confess. Every time I found myself in need for some sort of Round-Robin Database, I took a peek at RRDtool, but that always looked too much complicated, so I gave up and crafted my task-specific tools.
But this time was different. There will be large amounts of data to report on, and a fully hand-crafted solution was not an option. So my RRDtool experience started, and I had to make sense of a number of stuff. But that seems much more understandable now, and I am glad I finally tried it (but much more to do, of course…). …RRDtool looks solid, flexible, reliable, and you can use it in many ways: directly on the command line, or via pipes, or from your programming language (in my specific case: Perl). Perl has nice interesting modules to manage RRD files; the two I am concentrating on so far are RRDTool::OO, which provides an object-oriented interface, and RRD::Simple, that provides a number of very interesting functionalities not provided by the standard tools, e.g.: adding a new datasource to an existing file.
One sidenote: I am not interested in the pretty graphs that RRDtool is capable create. What I need is an intelligent data collection and aggregation tool, and RRDtool seemed to be exactly what I was looking for.
As always, I don't like the hello-world-like kind of examples, so I started to read the rrdtutorial document and went on on my own soon after. My "learn it yourself" example will be: collect some load average data from a machine (my laptop), store it in an RRD, and then fetch the data. I didn't feed the data to RRDtool on the fly; instead, I timestamped it and saved it in a file, so that I could do all my research on a known set of data, and I could compare my results with the original data.
So I started collecting the loadaverage every two seconds, and leaving an "hole" in the data (so that I will have some Not-a-Number data points in the final archive. This lead to 6960 data points with a 2 seconds resolution. Data collection started at the UNIX timestamp 1285605480 and ended at 1285620327, that is 14847. So far, so good.
The file is formatted as follows:
1285605480:0.00:0.00:0.00
1285605482:0.00:0.00:0.00
1285605484:0.00:0.00:0.00
1285605486:0.00:0.00:0.00
and so on.
Now, in the final archive I don't need that much information (or, at least, I pretend I don't). So, while I am feeding information every two seconds, I will aggregate all in 10 seconds data points (PDP in RRDtool parlance). The sign that the aggregation is working well will be that the plots of the original datapoints and the calculated datapoints will mostly overlap.
How much data should I save in the RRD so that I can span all the time interval the data was collected: that's an easy computation: we had an interval of 14847 seconds, and we are saving a PDP each 10 seconds: I need at least 1485 points. Let's round it to 1500.
The resulting creation command line is:
rrdtool create test.rrd
  --start 1285605479
  --step 10
  DS:loadavg1m:GAUGE:20:0:U
  DS:loadavg5m:GAUGE:20:0:U
  DS:loadavg15m:GAUGE:20:0:U
  RRA:AVERAGE:0.5:1:1500
Let's examine it piece by piece.
- We are creating a file named test.rrd, which allows samples timestamped after 1285605479. That's why I had to put a timestamp which is a second earlier than my first sample. Common habit seems to suggest 10 seconds anyway.
- The step is set to 10 seconds. This means that we'll collect data and aggregate it in 10 seconds PDPs: if more then one sample is provided in 10 seconds, they will be aggregated in a PDP.
- Then come the DS chunks. Each DS chunk defines a data source. The first parameter is the name of the data source; the second is the type of data, in our case: GAUGE. GAUGE is the data source type suited for measures that come from some kind of indicator, as could be a thermometer or -in our case- a load average gauge. More informations and examples are in the documentation.
- Our GAUGE is configured to have an heartbeat interval of 20 seconds (it seems to be customary to set it at 2*step, but you may have reasons to set it differently: take your time and read the docs about it). The heartbeat is the maximum tolerated delay between two samples: if two consecutive samples come in with as much delay or more, the intermediate data points will be considered unknown (and probably dumped as NaN's when you fetch the data).
- The final two pieces state that the minimum allowed value for this data source is 0 (as you would expect from load average) and the maximum is unknown (that's the meaning of U). Data outside this bounds will not be taken into consideration. If you don't know anything about the nature of your data, you can set these bounds to U:U; in this case, all data will be considered valid.
- The two following DS lines are more or less the same, and they account for the 5 and 15 minutes load average respectively.
- The RRA line creates a Round-Robin Archive inside the RRD. RRAs archive the data from the data sources in different ways, and it's what we will query with
rrdtool fetch. We'll use the AVERAGE function, which means that we'll aggregate an average of our datapoints (how many? Read on!). The computed datapoint will be computed only if the number of unknown datapoints in the interval is less than 50 percent of the total. - We'll compute the average of 1 datapoint… oh well, what does this mean??? It means that we are actually saving each computed datapoints!!!
- And how many will we save? 1500, as we decided earlier on: that will be enough to cover the full interval we sampled.
We have defined a single RRA, and rrdtool is smart enough to query that one. But when querying an RRD that has multiple archives using the same aggregation function in it, you'll need to provide the desired resolution as well, so that rrdtool will know which archive you are referring to.
The file is created, it's now time to feed it with the values:
cat loadaverage.txt | xargs rrdtool update test.rrd
Yeah, that was simple. So what's in the file now? Let's fetch:
rrdtool fetch test.rrd AVERAGE --start 1285605480 --end 1285620327
You may think I was too verbose here, and that it shouldn't actually be needed to provide a start and an end timestamp. You may be right: you can try it without those options, get a result that you didn't expect, and then understand that it is much better to provide them. At least, that's what happened to me.
Back to the fetch command, it returns:
                      loadavg1m           loadavg5m          loadavg15m

1285605490: 0,0000000000e+00 0,0000000000e+00 0,0000000000e+00
1285605500: 0,0000000000e+00 0,0000000000e+00 0,0000000000e+00
1285605510: 0,0000000000e+00 0,0000000000e+00 0,0000000000e+00
1285605520: 0,0000000000e+00 0,0000000000e+00 0,0000000000e+00
and so on. You may notice a few things here:
- the data comes in 10 seconds step, as expected
- you are fetching aggregated data for all the three data sources
- timestamp and data are separated by a colon
- numbers use the comma as decimal separator, and they are in exponential notation
If I want to plot them with gnuplot, it will need some massaging: that colon must go, and commas must change in dots. That's easy:
rrdtool fetch test.rrd AVERAGE --start 1285605480 --end 1285620327 |
  perl -ne 'next if not /:/ ; next if /nan/ ; s{:}{ }g ; s{,}{.}g ; print' > rrdpoints
And also points in laodaverage.txt need some massaging:
perl -ne 'next if not /:/ ; next if /nan/ ; s{:}{ }g ; print' loadaverage.txt > loadaverage.points
Well, now we have rrdpoints and loadaverage.points. Plot time. In gnuplot:
plot "./loadaverage.points" using 1:2 with lines,
  "./rrdpoints" using 1:2 with lines,
  "./loadaverage.points" using 1:3 with lines,
  "./rrdpoints" using 1:3 with lines,
  "./loadaverage.points" using 1:4 with lines,
  "./rrdpoints" using 1:4 with lines
which gives:
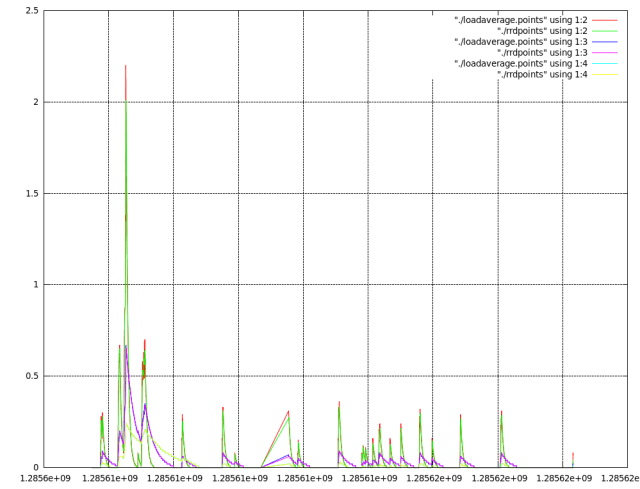
And, as you can see, plots overlap as expected. Hooray! I am finally ready to start with some more serious stuff!
