This is a note-to-self style post 😉
Today I needed a simple graph to propose a re-engineering of a Terraform module of ours. I could of course use a tool like LibreOffice Draw, or maybe ask AI to give it a shot; but being the graph so simple, I thought I would just resume the little knowledge of GraphViz I had from before to solve this even quicker. I fired a couple of quick questions to ChatGPT to refresh the basics, and woop! In 5 minutes I had my graph:
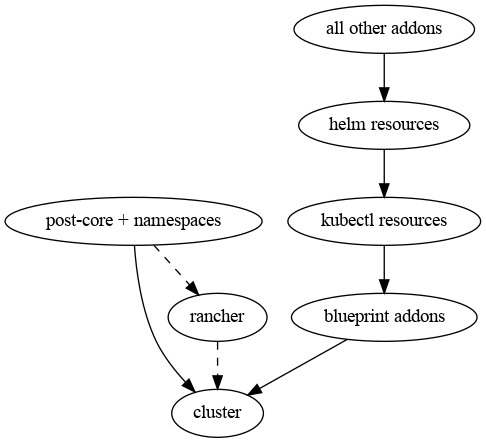
digraph ModEks {
  cluster;
  postcore [label="post-core + namespaces"];
  rancher;
  blueprint [label="blueprint addons"];
  kubectl [label="kubectl resources"];
  helm [label="helm resources"];
  addons [label="all other addons"];

  rancher -> cluster [style=dashed];
  postcore -> rancher [style=dashed];
  postcore -> cluster;
  blueprint -> cluster;
  kubectl -> blueprint;
  helm -> kubectl;
  addons -> helm;
}
I think it’s easy to understand what this code does (and if not, it will be once you glance at the diagram), so I’ll skip the explanation.
I saved this code into a file called ModEks.dot and then ran this command in a terminal:
dot -T png ModEks.dot -o ModEks.png…and there was my graph:
 This is mostly a note to self. When I need an EC2 instance to run a quick test, it may be overly annoying to provision one through the web console, or it may feel a bit overkill to do that using large frameworks like terraform. Using the AWS command line is just fine, if you know what command to run with which parameters, and it pays off quickly if, to run your tests, you use the settings often (AMI, subnet, security groups…) or if during the same test session you need to scrap and rebuild test instances a few times. Here is an example on how to do so with the AWS command line client.